X-rays, punch cards and iron wires
Nature at the atomic level
Since the Greeks, scientists had suspected nature should be made of small pieces, which they called "atoms". By the beginning of the 20st century it was accepted that atoms existed, and were capable of attaching to each other. The resulting structures, which were named "molecules", had chemical and physical properties determined by their specific atomic structure. Experimental techniques had been developed to figure out the composition and arrangement of atoms forming a molecule, yet no one had ever seen how a molecule actually looks like. But then scientists started noticing that light crossing a crystal made up of the molecule of interest would bounce through it in specific ways. Even more interesting this phenomenon, called scattering, depended on the specific arrangement of atoms in the crystal. A technique called X-ray crystallography was established: thanks to it, scientists could use light to determine how atoms arrange themselves in space to form molecules. Nobel prizes for the establishment of this technique were awarded to Max von Laue in 1914 as well as to William Henry and Lorence Bragg, father and son, in 1915.
 William Henry Bragg
The first sample to be studied, in 1914, was the simple table salt. But X-ray crystallography was shown capable of analysing much more complicated structures. From the 1950s it became very popular to study proteins, very large molecules that are key components of every living organism. John Kendrew solved the first structure of a protein, myoglobin, for which he won a Nobel prize in 1962 alongside Max Perutz. Dorothy Hodgkin succeeded in solving the structure of vitamin B12, for which she awarded the Nobel prize in 1964, and later that of a protein, insulin.
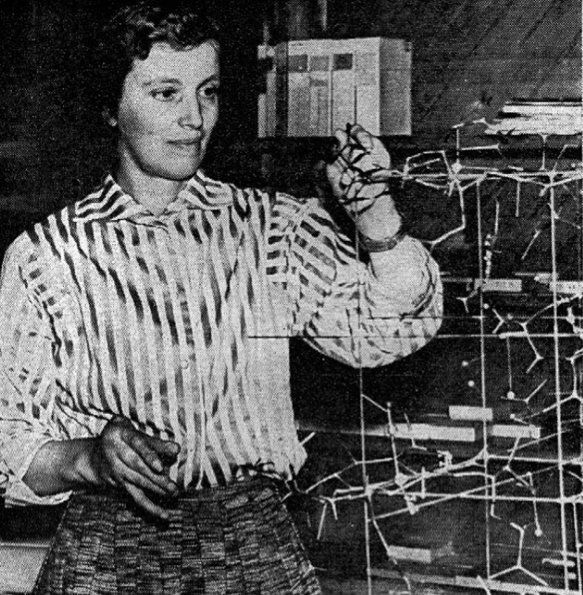 Dorothy Hodgkin
Computers to the rescue
Several researchers worldwide started obtaining atomic structures, which opened the questions: how can I record this information? How do I store it so that it is safe, and can be exchanged with other scientists? Nowadays one would say: “well save it in a computer, of course!” At that time, though, computers did not look like what we are used to nowadays. The first commercial computers started being sold in the 1950s, and they were massive closets full of wires that could take a whole room! 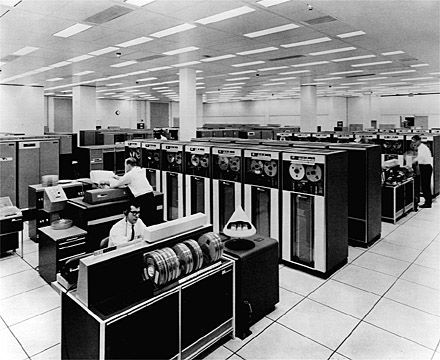 The IBM 7090 mainframe computer
The first computers had no keyboard or mouse. And computers had no storage memory either. The way to both talking to them and permanently storing information was via small carboard pieces called punch cards. Punch cards were small rectangular cardboards divided into 80 columns. Each column could have holes pierced in one or more places. The position of holes in a column was uniquely assigned to a character such as a letter, a number, or punctuations. Since every card could store 80 characters, most often one had to use multiple cards to store all the information needed.
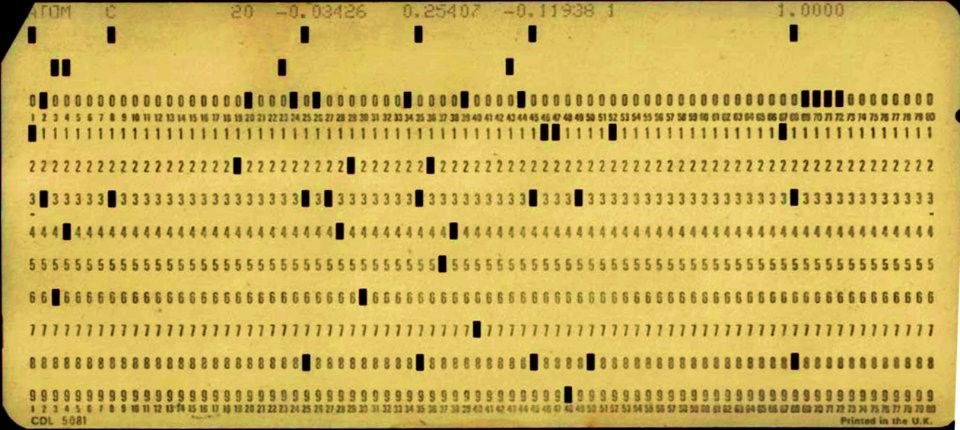 A punch card with information on one atom
To store information about a molecule, one would need to record data about the experiment carried out, and then describe every single atom with its specific name, coordinates in space, and other useful data. All the information about a single atom required quite a lot of characters, so scientists ended up using one punch card per atom. Every column in a punch card would contain a specific piece of information, and a molecule would end up being a (pretty thick) stack of punch cards. The last characters on every punch card would be a unique index number, so you could put back together your molecule in case you dropped it on the floor!
 A luggage used to transport punch card stacks
How does a protein look like?
So, once you have your molecule’s data, what can you do with it? Since the structure of a molecule determines its chemical and physical properties, scientists started using computers to predict these. But another great thing was that this data allowed scientists to build actual three-dimensional models, that one could touch. This was really helpful, from both a scientific and educational perspective. A traditional way of representing a molecule was via a “balls and sticks” representation, where atoms are spheres connected by small metallic rods describing chemical bonds.
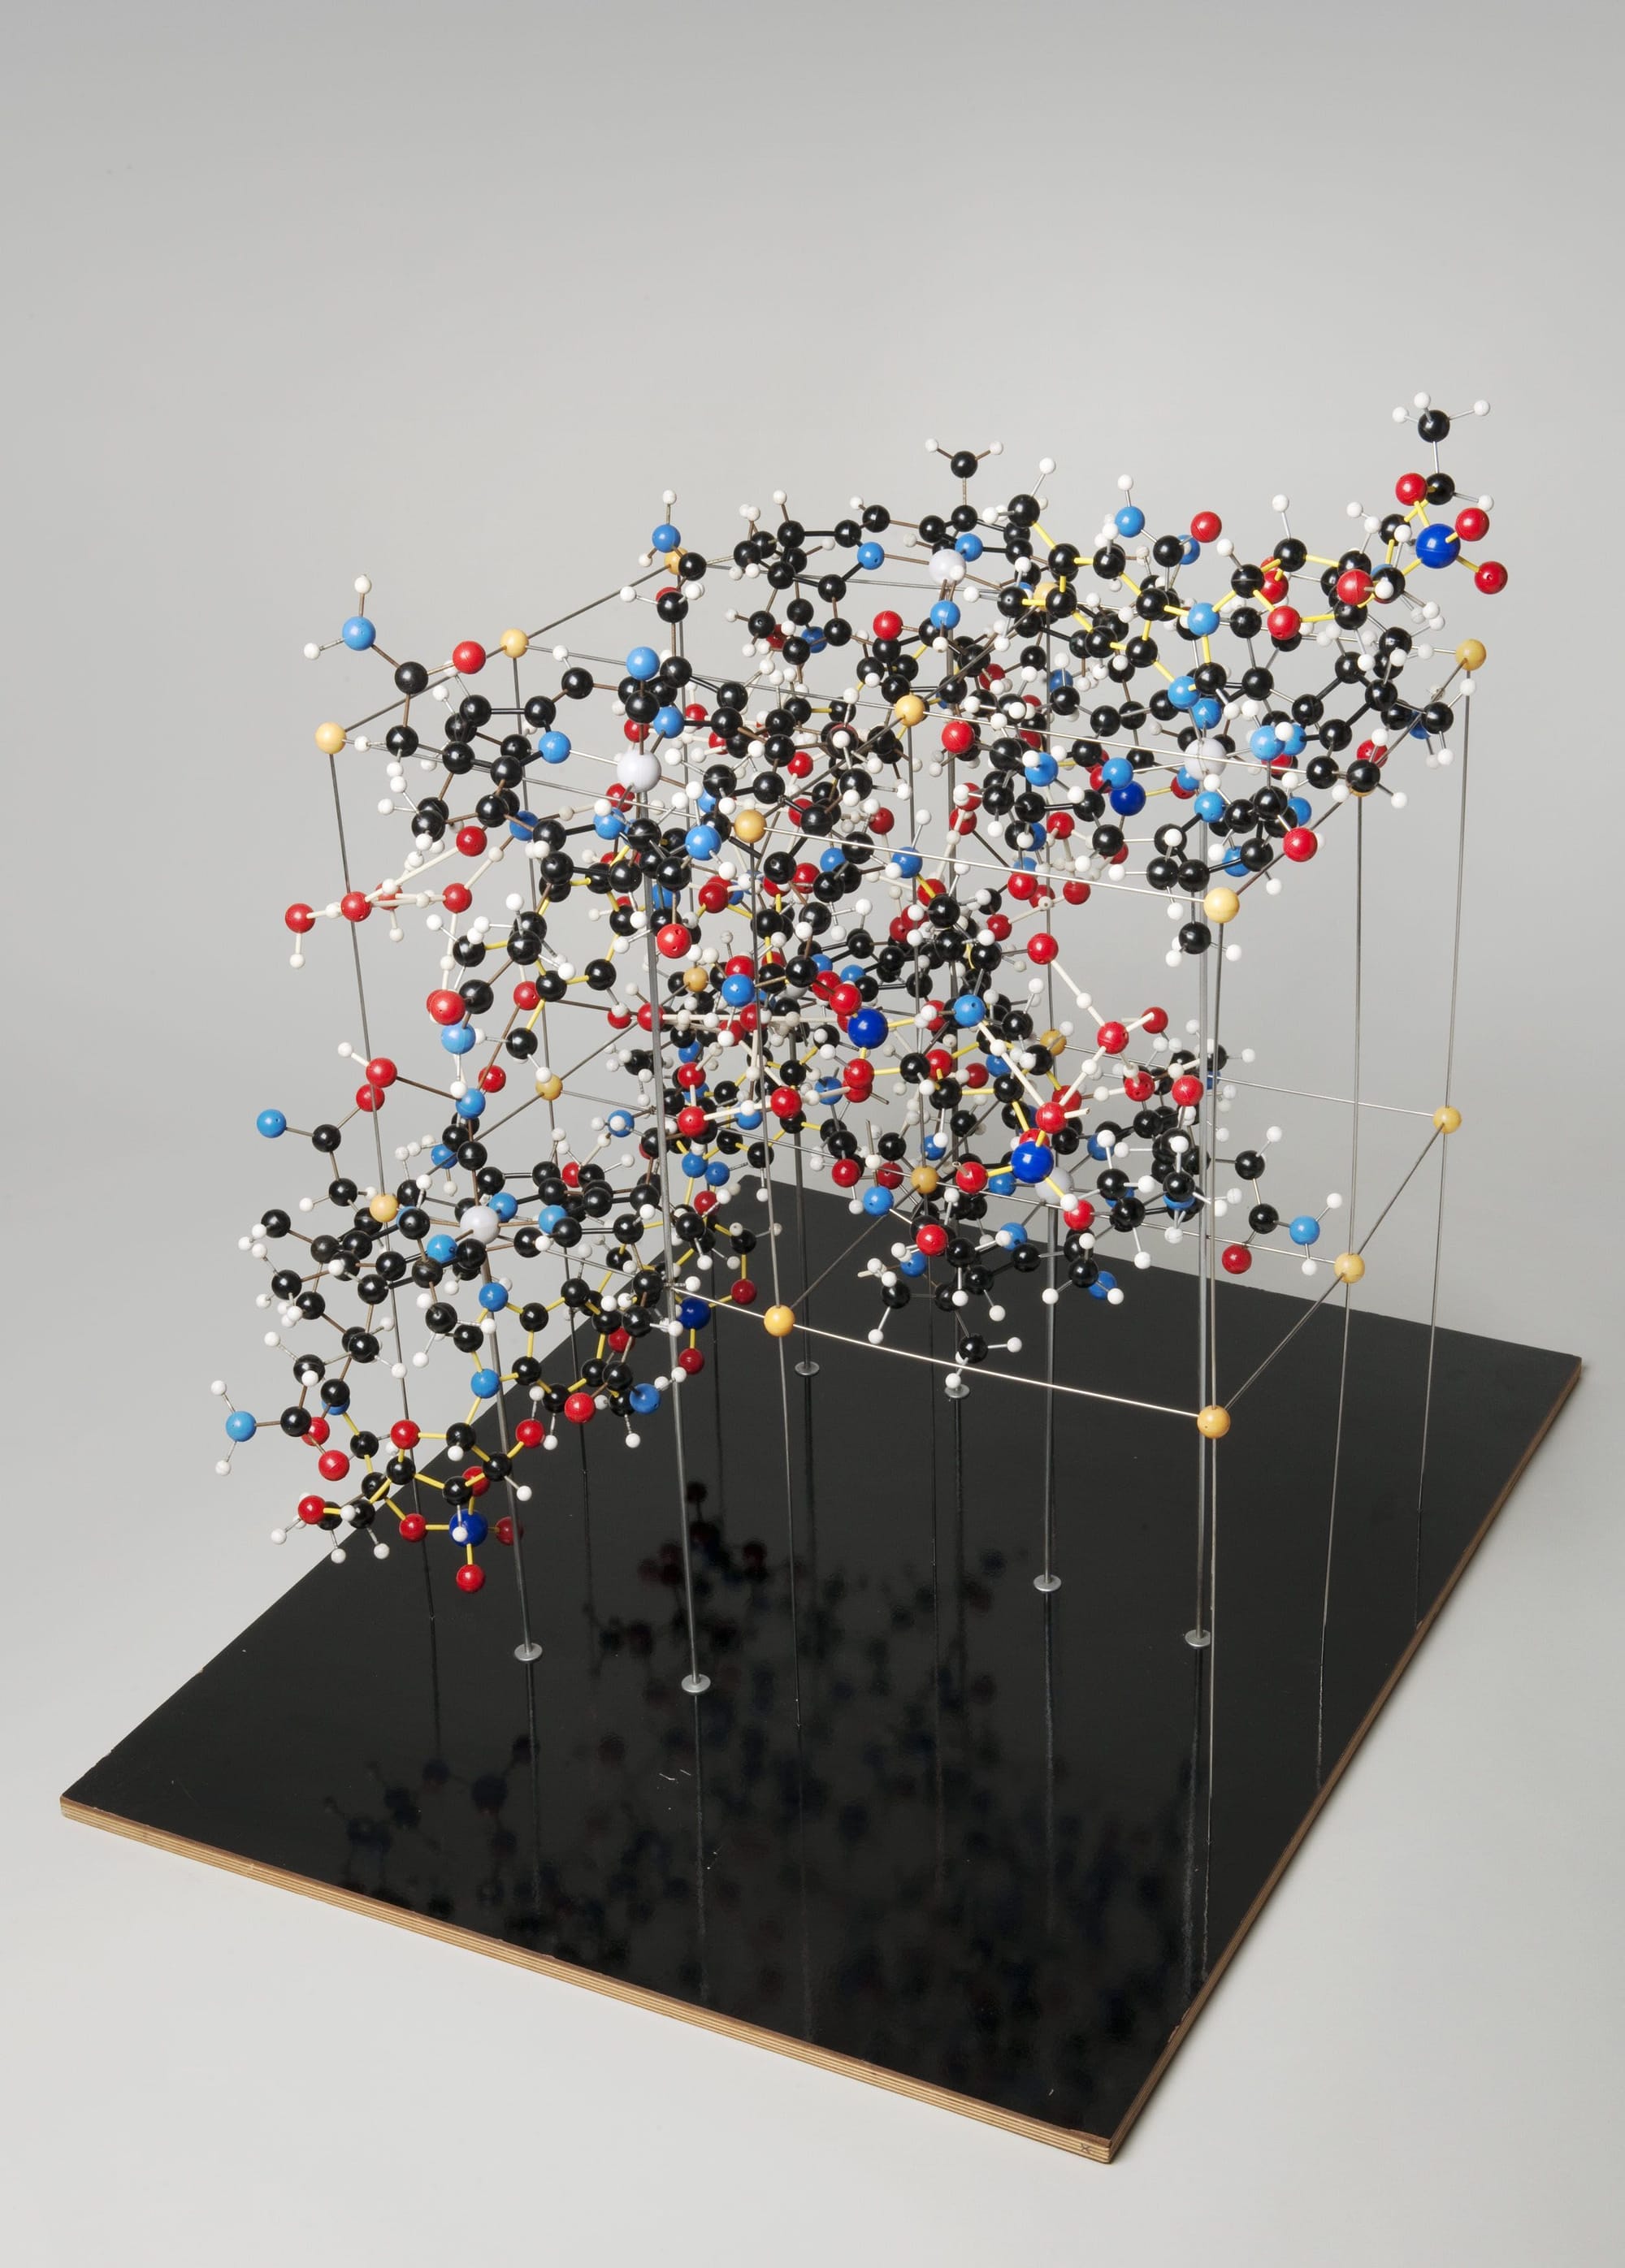 The structure of vitamin B12, solved by Dorothy Hodgkin (source: London Science Museum)
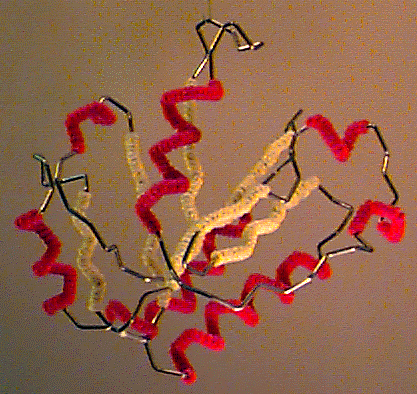
The problem was that X-ray crystallography kept getting better and better, allowing studying larger and larger molecules. Proteins, in particular, can get really big (they can be made of thousands of atoms!) which made building balls and sticks models increasingly complicated and cumbersome. A simpler way of representing a protein was needed. Proteins are made of chains of smaller molecules (called amino acids) that arrange themselves like beads on a string that then folds onto itself to form a specific three-dimensional shape. This gave the idea: if we just want to see what the general shape of a protein is, why don’t we just represent the shape of the string, instead of showing the position of every individual atom it is made of? This was the origin of what is called a “cartoon representation”, at present still one of the most common ways of displaying a protein structure. This representation was so simple yet effective that in 1972 two scientists, Byron Rubin and Jane Richardson, presented a computer-controlled machine to automatically fold iron wire according to any desired protein shape. What was then called the “Byron’s bender” became popular throughout the ’70.
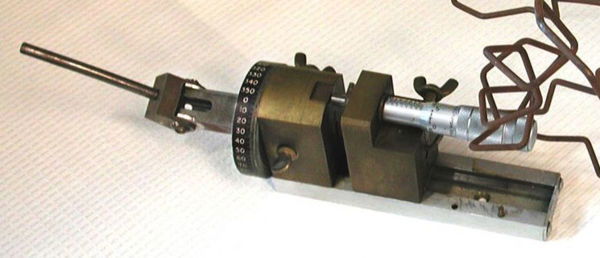 Byron's bender
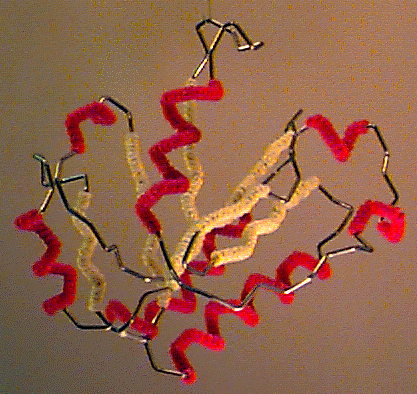 A protein model produced using Byron's bender
Sharing science: the protein data bank
Scientists exchanged copies of their punch card stacks with information on molecules until, in the early '70, the community realised that it would be great if there were a central repository storing every solved molecular structure. This led to the establishment of the Protein Data Bank (PDB), with storage and distribution centres of molecular structures in Cambridge (UK) and Brookhaven (USA). In 1974 the PDB contained 13 protein structures, and this number grew rapidly. The PDB stored protein structures onto a new and less cumbersome technology: magnetic tapes. Nevertheless, the format of data initially defined for information storage within punch cards remained: data for one atom would be stored in a line composed of 80 characters. Scientists could request a copy of molecular structures by letter, attaching money for postage expenses, and later via a new computer network technology called “Internet”. With the advent of the Internet the PDB opened freely accessible online portals, and eventually only became accessible online. Software with beautiful graphical interfaces was developed so that now scientists can visualise on their screens proteins in three-dimensional balls and sticks, cartoon representations, and more.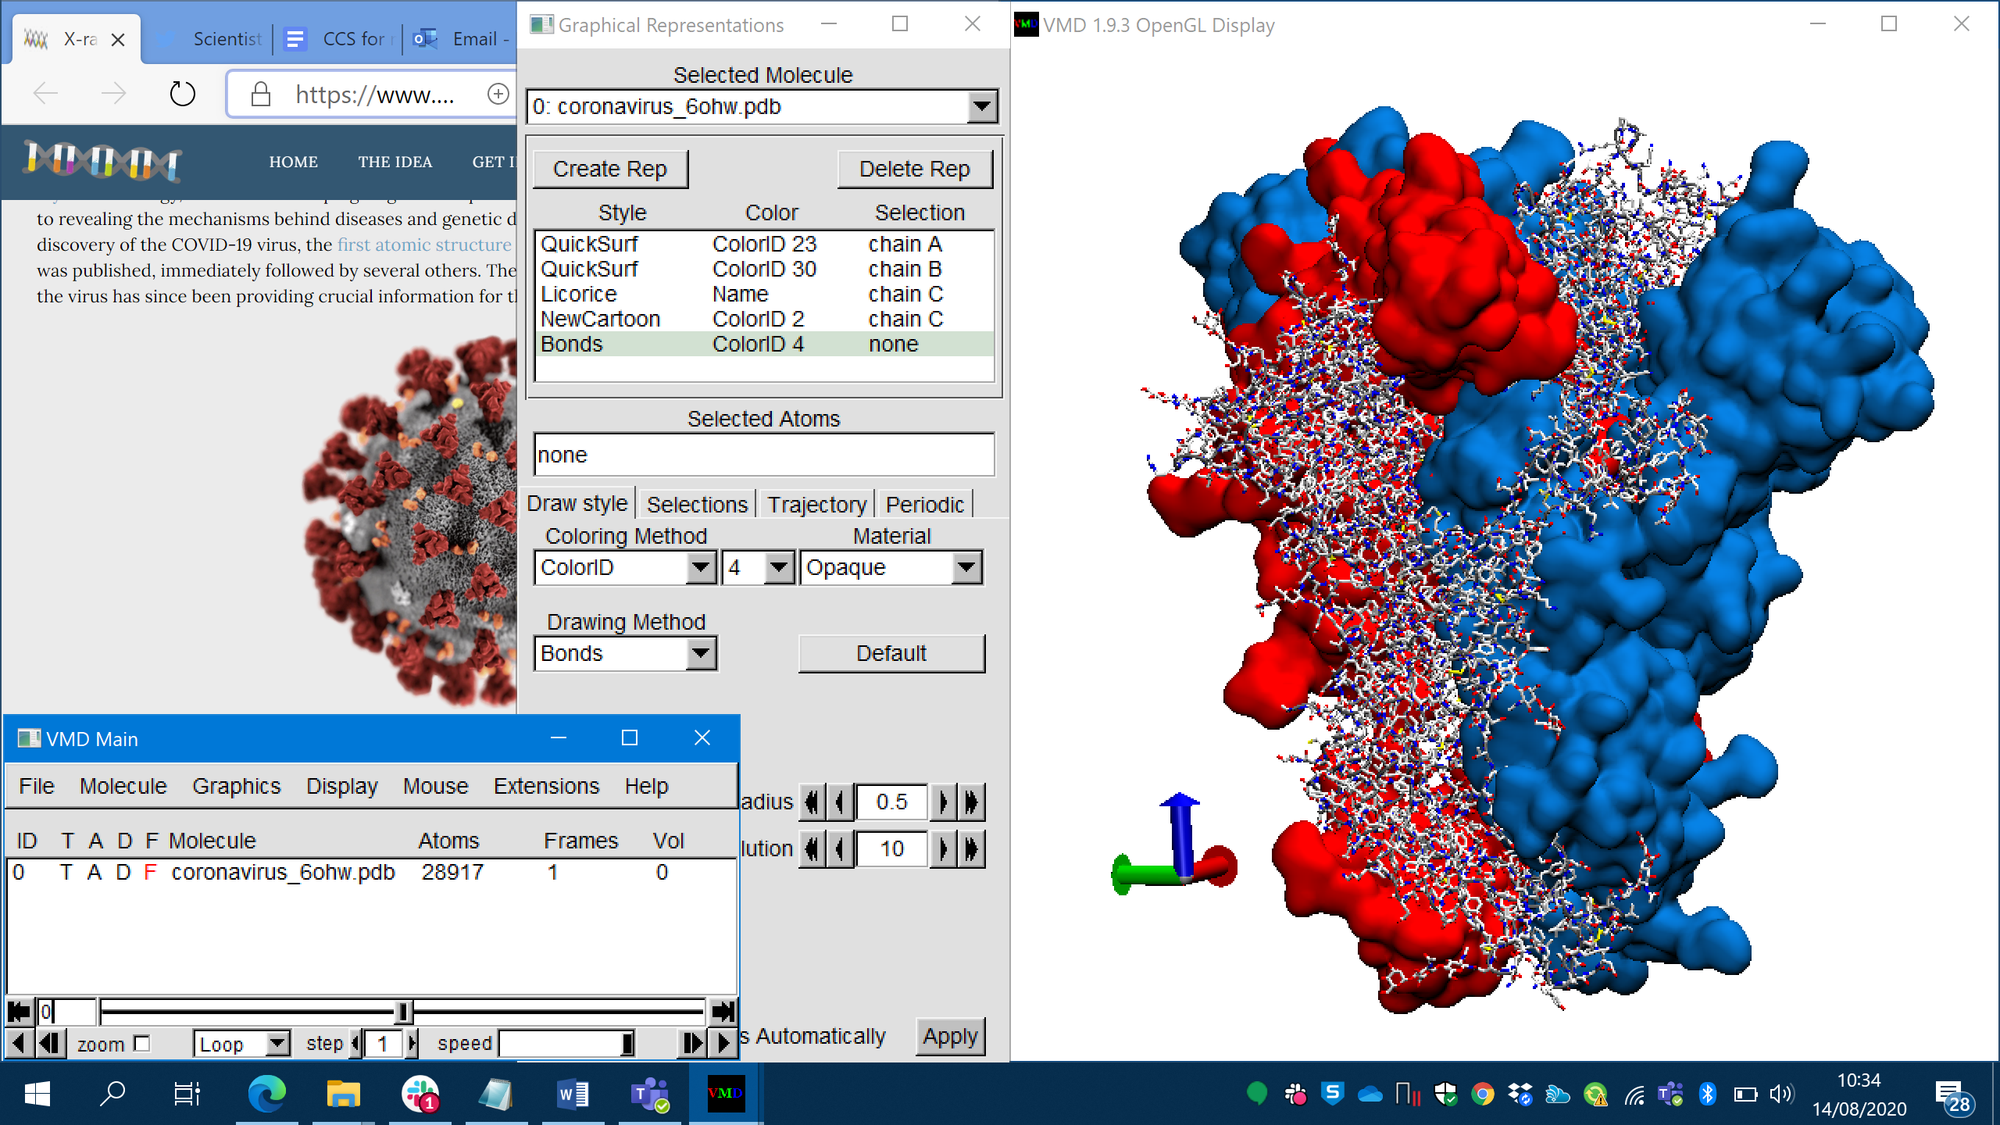 Scientists use software to visualize and analyse the 3D structure of proteins. In the image, three proteins sticking together to form the spike of COVID-19, two shown as solid surfaces, and one with all its atoms and bonds.
Throughout all this time, X-ray crystallography kept improving, and new methods to investigate molecular structures (nuclear magnetic resonance and cryo electron microscopy) were developed. In 2019 the PDB contained more than 150’000 molecular structures. Molecules studied became so big that the data format used by the PDB, still based on punch cards, became restrictive. After several years of debating, the PDB finally discontinued the usage of this old 80 characters-per-line data format. What started thanks to punch cards made the final jump to the era of big data.
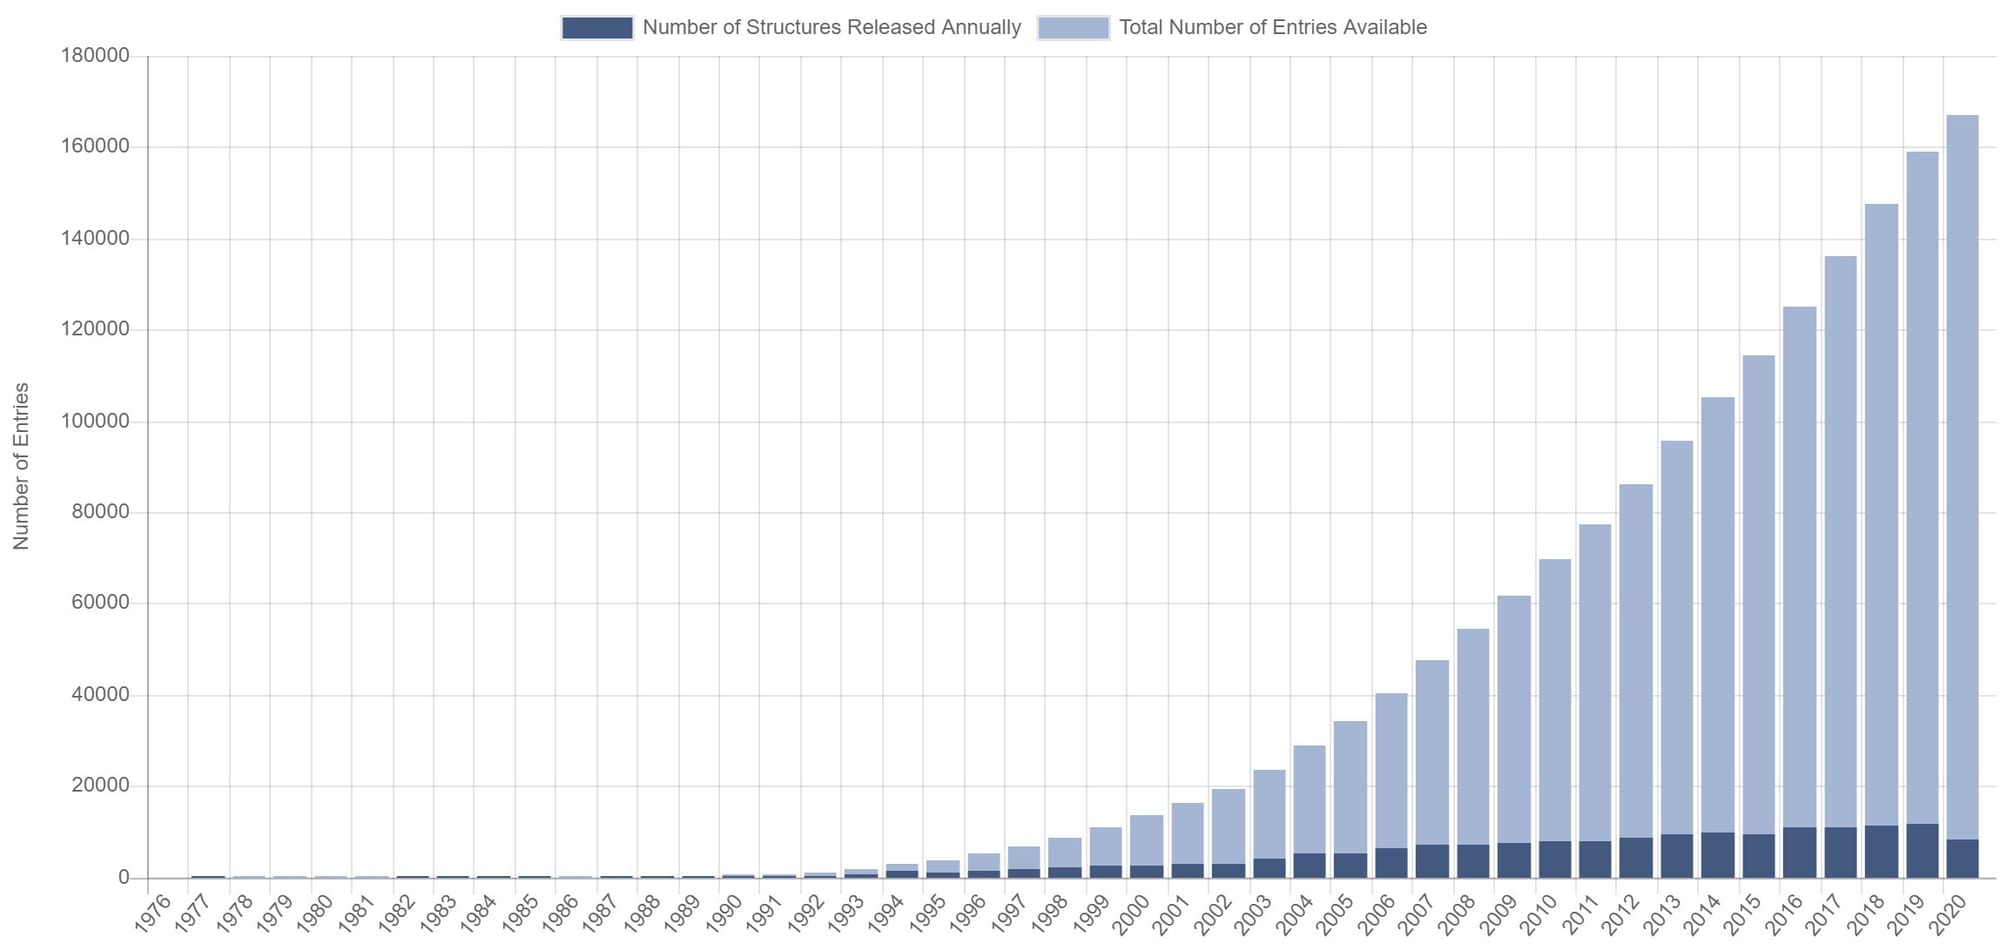 The number of structures deposited in the PDB databank has been growing increasingly fast (source: PDB databank, August 2020)Understanding the structure of life and diseases
The study of atomic structure of molecules has had a tremendous impact on society. It is now the research area of many thousands of scientists, including many participating to SND such as Sofia, Toni, Venkat, Lucas or myself. In biology, this has been helping us gain a deeper understanding of how life works, and has contributed to revealing the mechanisms behind diseases and genetic disorders. In March 2020, only few months after the discovery of the COVID-19 virus, the first atomic structure of one of its key component, the “spike protein” was published, immediately followed by several others. The knowledge acquired on the molecular structure of the virus has since been providing crucial information for the development of a cure.
 A graphical representation of COVID-19, with the spike protein shown in red
- by Matteo Degiacomi